Why Monitor Cron Jobs?
Cron jobs are used for scheduling tasks like backups, emails, status checks etc. These cron jobs can have a major impact on the performance of your web servers and applications. This makes it essential to continuously monitor them and gain insight on important jobs and back-end systems.
With our monitoring solution, you can now have the answers to three of the most important questions related to cron monitoring:
- How many and which cron jobs are running now or for any given time period?
- How long have your tasks been running?
- Are any of your jobs failing, stuck, or running longer than expected?
Add a Cron Monitor
Start tracking your jobs, workers, services, or anything that can send a HTTP request.
You can create a Heartbeat by selecting Heartbeats on your Dashboard.
You can configure time and grace period and what kind of reports you want by clicking “Advanced Settings”.
If you select Advanced Settings, you can configure additional features.
After submitting you will get a link:
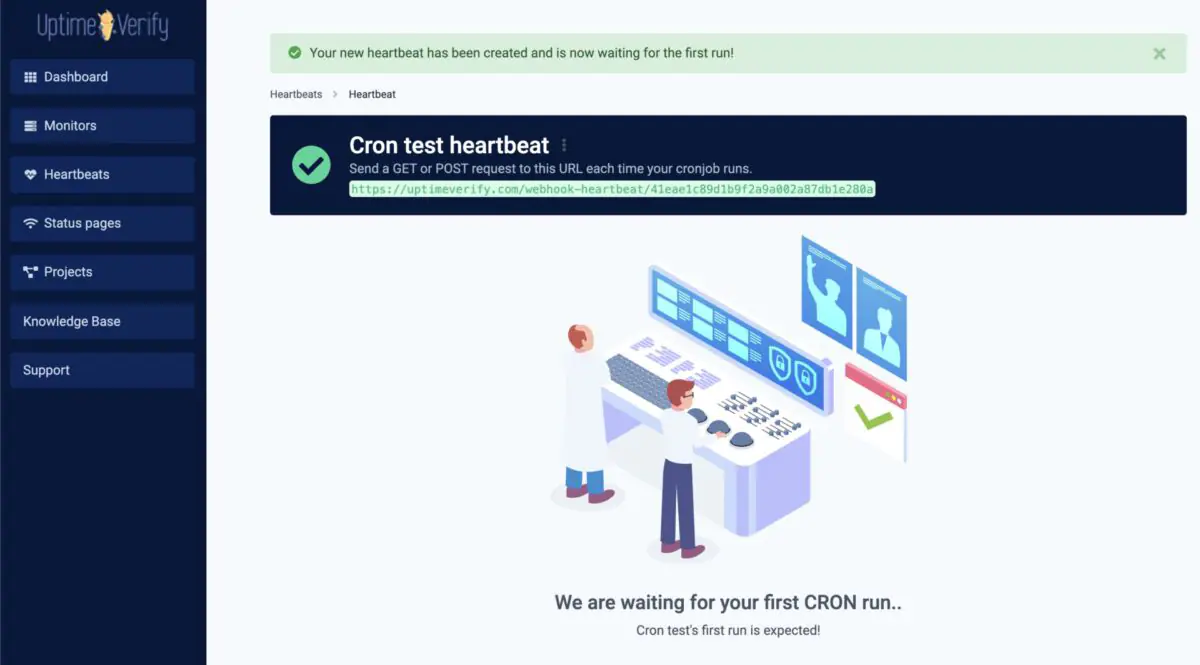
You need to copy the link and add a cronjob by either GET or POST on your server. You need to run it within time frame you have chosen when creating your monitor.
Using Cron Expressions
A cron expression allows for greater flexibility, and helps to define fixed time schedules. It consists of five fields, separated by spaces.
Syntax of a Cron Expression:
m h dom mon dow
* * * * * test.sh
| | | | |
| | | | #——— Day of the Week (0 to 6) (Sunday = 0 or 7)
| | | #———– Month (1 to 12)
| | #————- Day of the Month (1 to 31)
| #—————- Hour (0 to 23)
#——————- Minute (0 to 59)
Duration Range:
- Minute(s) 0-59 / * means every minute at the start of each minute
- Hour(s) 0–23 / * means every hour at the start of every hour
- Day(s) of month 1–31 / * means every day
- Month(s) 1–12 / * means every month, you can use month names if you prefer
- Day(s) of week 0–7 / 0 and 7 both mean Sunday, you can also use names
Examples:
Triggers cron monitor every night at 11 PM so you should have configured monitor time 1 day:
Triggers cron monitor every night at 11:45 PM so you should have configured monitor time 1 day:
Using /N interval to have all values in a specified range run in intervals of N, say for every nine minutes (0, 9, 18, 27, 36, 45, 54) so you should have configured 9 minutes on time when creating your monitor:
Once you start to call this script, monitor will calculate and wait for the next trigger in X minute, hour or day you have chosen.
Do not browse this link before adding to your crown as you will trigger monitor cycle and your monitor will alert as timing will not match. If you already did it, delete and create another heartbeat for work around.
